
Properties of Polymers
There is almost no end to the properties we can measure on a material — far more than fit on a single page. Here we present the ones you will meet most often; if you want to go deeper and explore the rest, I cover them in much greater detail in my book Plastic Polymers.
One thing worth being clear about from the start: every measurement must follow procedures laid down by recognized standards bodies. Several exist around the world — among them DIN (Deutsches Institut für Normung, the German standards institute) — but the two most widely used for plastics are ASTM (American Society for Testing and Materials) and ISO (International Organization for Standardization). Those standards are what let two laboratories on opposite sides of the world compare results and trust that they mean the same thing.
Here we gather the properties that are most commonly used and reported, grouped into five families:
• Mechanical Properties
• Thermal Properties
• Electrical Properties
• Optical Properties
• Other Properties
Mechanical Properties
Mechanical properties describe how a material behaves when subjected to external forces or loads. They dictate a material’s suitability for specific engineering applications, manufacturing processes, and structural designs.
Flexural Properties – ASTM D790
Flexural Modulus
The flexural modulus (or bending modulus) is the ratio of stress to strain when a material is bent — in other words, a material’s tendency to resist bending. It is taken from the slope of the stress–strain curve produced during a flexural test, and it is expressed in units of force per unit area.
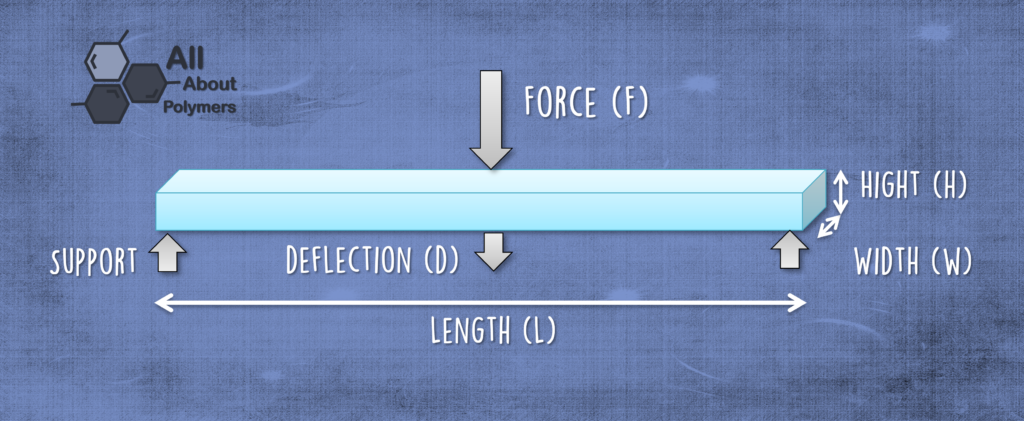
A bar is supported at both ends like a simple beam and loaded at its center in what is called three-point bending. The bar is flexed until it breaks or until it reaches 5% strain, whichever comes first. Flexural properties are measured under ASTM D790.
Flexural Stress
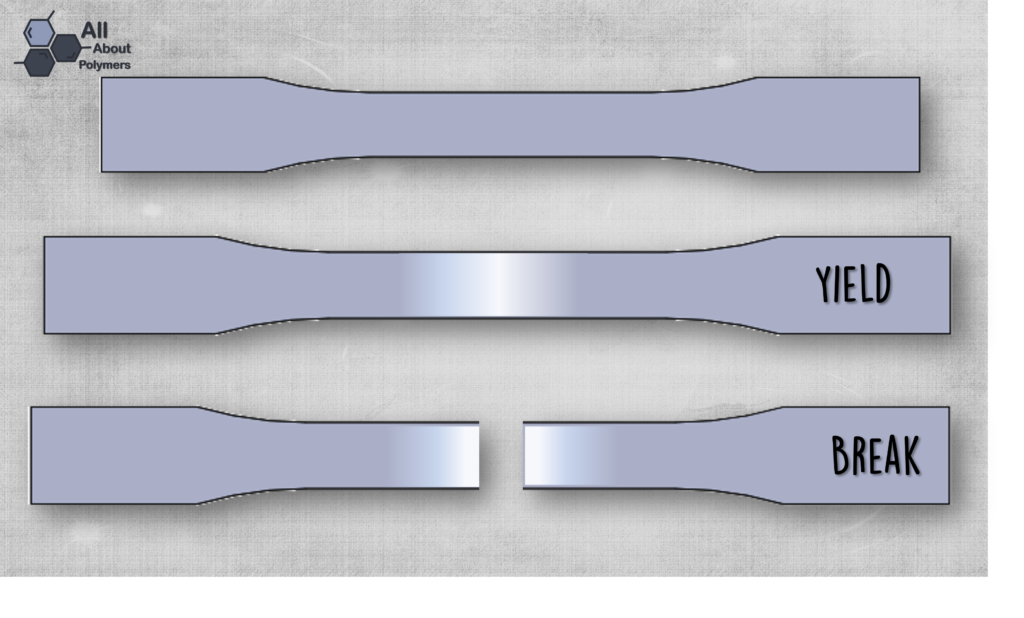
This is the stress at the outer surface of the test bar when force is applied at its midpoint. The ASTM D790 test measures both the stress at yield and the stress at break. Yield is the point at which deformation becomes permanent. A familiar example is stretching a rubber band: you can pull it and it springs back, but at a certain point the center begins to look whitish — a sign the band has yielded and there is not turning back.
Flexural Strength
This is the maximum flexural stress a material can withstand. It is also known as the modulus of rupture, bend strength, or fracture strength.
“The mechanical properties of a polymer describe how a material responds when we push, pull, bend, strike it or any other type of effort or abuse.”
Tensile Properties – ASTM D638, ISO 527
A tensile test is run by stretching a test specimen and measuring the load it carries. The deflection and load values translate into a stress–strain curve, and a whole family of properties can be read from that single curve.
Tensile Modulus
This is the ratio of tensile stress to tensile strain in the elastic region of the stress–strain curve. A “tangent” tensile modulus is the slope of that elastic region, and it is also known as Young’s modulus or the modulus of elasticity.
Elongation at Break
Elongation at break — also called strain at break or fracture strain — is the ratio of the change in length to the original length at the moment the specimen ruptures. In plain terms, it is a measure of ductility: how far a material can stretch before it finally breaks. A high elongation at break tells you the material can deform a great deal before failing.
Tensile Strength at Yield
Tensile strength at yield is the level of tensile stress at which the rise of the stress–strain curve first reaches zero — the first point where stretching no longer increases the load. Tensile strength at break is the tensile stress at the moment the specimen tears apart.
“Yield is the point at which deformation becomes permanent. Like stretching a rubber band: you can pull it and it springs back, but at a certain point the center begins to look whitish — a sign the band has yielded and there is not turning back.”
Impact Resistance
Impact resistance describes a material’s ability to absorb a sudden blow and the energy of impact without breaking. It is calculated as the ratio of the energy absorbed to the cross-sectional area of the specimen. Toughness, a closely related way of describing impact behavior, depends on both temperature and the shape of the specimen.
Pendulum Impact – Izod and Charpy
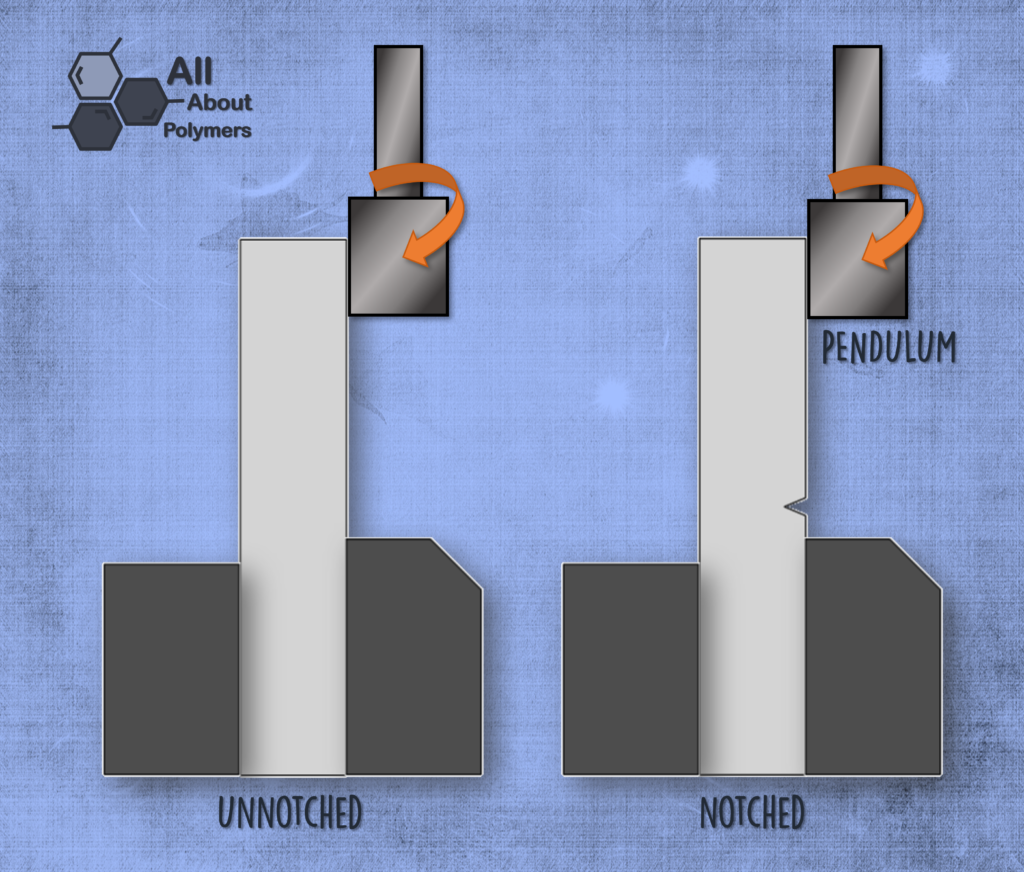
Several methods exist for measuring impact resistance. The most widely used involve striking the side of a specimen with a swinging pendulum: Izod (ASTM D256, ISO 180) and Charpy (ASTM D6110, ISO 179).
Specimens can be struck whole, or a notch can be cut into them first to increase their sensitivity to impact. The notch geometry differs from one method to another.
The two methods differ in how the specimen is held: in Charpy, the bar is supported at both ends; in Izod, it is clamped at only one end. The point of impact also differs between them.
Falling Dart Impact — ASTM D5628, ASTM D5420, ISO 7765
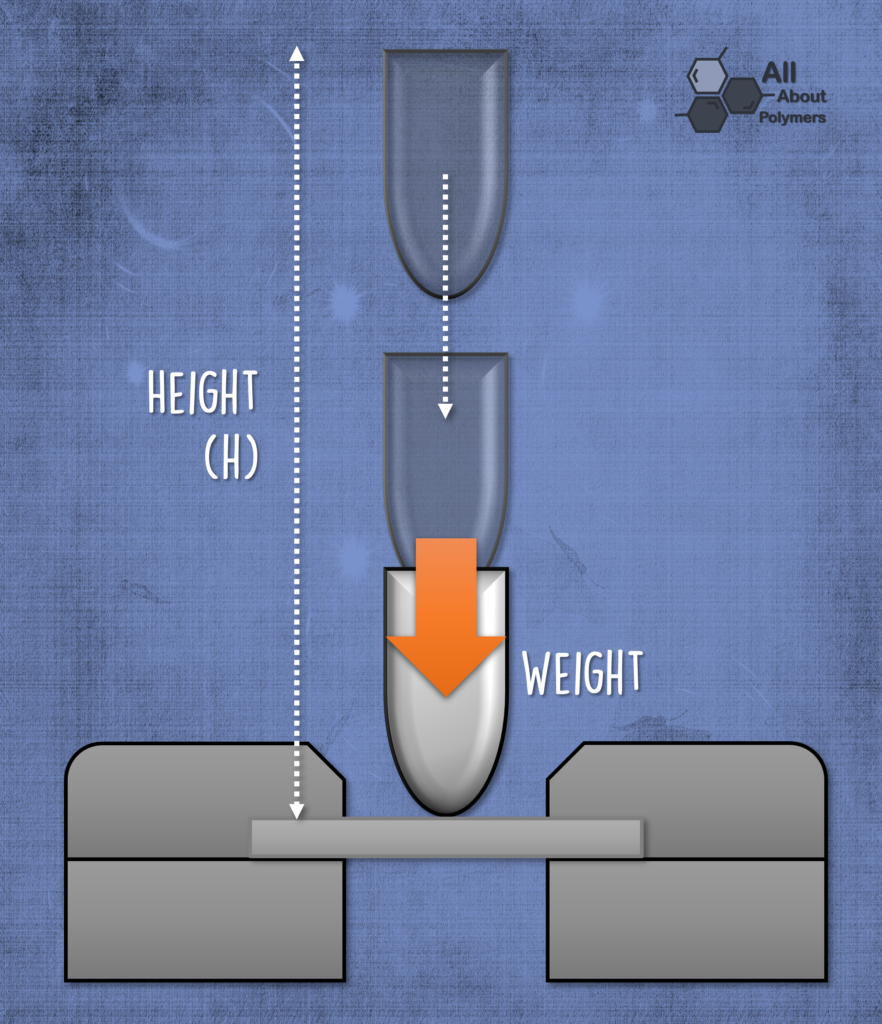
In falling-dart testing, a dart of defined size and weight is dropped from progressively different heights until it finds the height at which the specimen deforms or fractures. The specimen is a flat plate held around all of its edges so that the dart strikes its center.
This test measures the energy needed to puncture a material by impact with a falling dart under specified conditions, and it captures a material’s multiaxial impact behavior. It can be run as a true free-falling dart (the well-known Gardner impact is one example) or with a computer-controlled dart such as Dynatup.
Hardness
Hardness is the mechanical resistance a material offers against penetration by a harder test body. It is not the same as strength, which is resistance to deformation. Hardness is also a guide to a material’s abrasion behavior — harder materials generally resist abrasion better than softer ones.
For thermoplastics, two test methods are commonly used. Alongside the ball-indentation test, Shore hardness is also determined.
Ball Indentation Hardness — ISO 2039-1
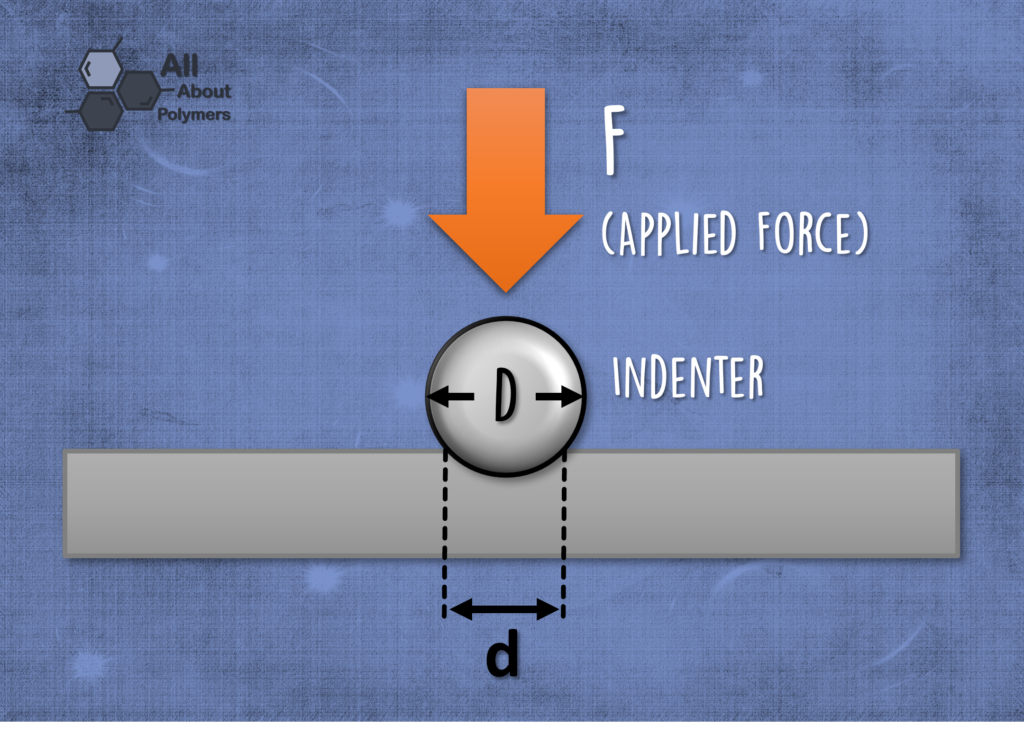
A ball 5 mm in diameter is pressed onto the specimen with an initial load of 9.8 N (newtons), which is then raised to a specified load for 30 seconds. The depth of the resulting indentation is measured to calculate the surface area of the impression. Hardness is then expressed as the load in newtons divided by the surface area of the indentation in mm² (N/mm² = MPa). The value is reported with an “H.”
Shore Durometer Hardness — ASTM D2240, ISO 868
This measures a plastic or elastomeric material’s resistance to indentation, based on the penetration of a cone-shaped indenter. Hardness values run from 0 (full penetration) to 100 (no penetration).
Two durometer scales are commonly used with plastics: A and D. The general guidance is to use the D scale when readings on the A scale rise above 90, and to use the A scale when D readings fall below 20. Type A values below 10 are considered unreliable and are not reported.
“Impact resistance describes a material’s ability to absorb a sudden blow and the energy of impact without breaking.”
Thermal Properties
Thermal properties tell us how a polymer behaves when exposed to heat: the temperature at which it softens, melts, or degrades. They determine both the temperature at which a material can perform without losing its characteristics, and the conditions under which it must be processed.
Melting Point — ISO 3146, ASTM D794
The melting point of a resin is the temperature at which it changes from solid to liquid at atmospheric pressure. At the melting point, the solid and liquid phases exist in equilibrium. The melting point depends on pressure, so a standard pressure is usually specified. The reverse change, from liquid to solid, is called the crystallization point.
A clear, sharp melting point is really a feature of semicrystalline polymers, whose ordered regions melt at a well-defined temperature. Fully amorphous polymers have no such ordered regions and so do not have a true melting point — instead they gradually soften over a range of temperatures.
Many thermal properties are determined using a differential scanning calorimeter (DSC).
Glass Transition Temperature — ASTM D3418
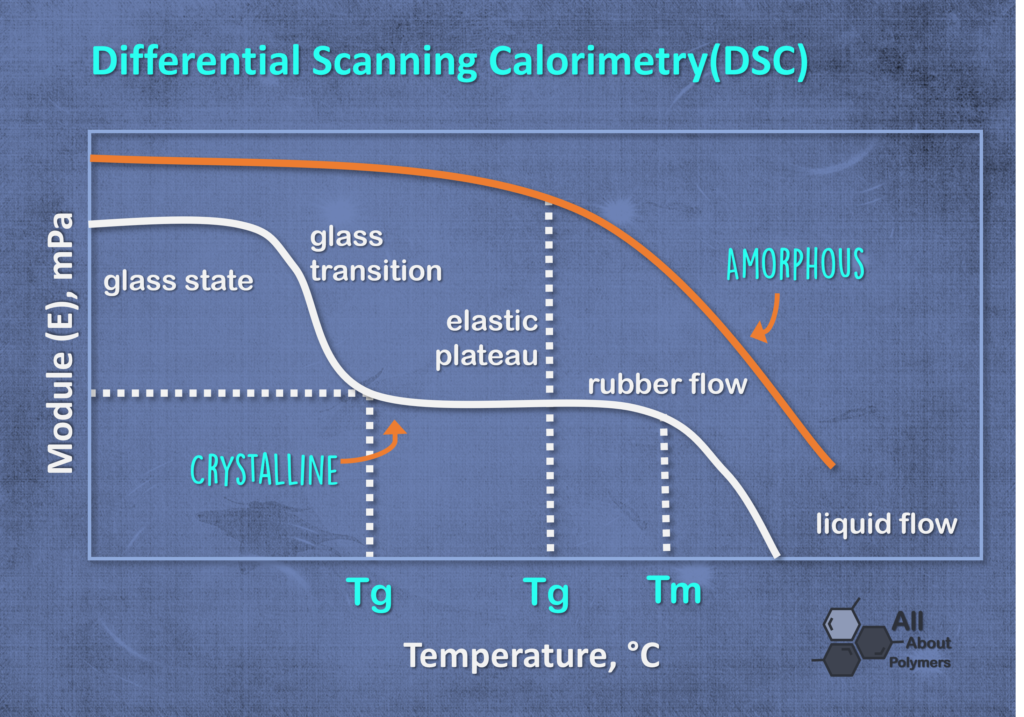
The glass transition is the reversible change in an amorphous polymer — or in the amorphous regions of a semicrystalline polymer — from a viscous or rubbery condition to a hard, relatively brittle one (or back again). It occurs at a temperature called the glass transition temperature, or Tg.
At the Tg, the physical properties of a polymer shift from those of a glass-like material to those of a rubbery one. It marks the onset of long-range motion in the polymer backbone as temperature rises. Picture the bead strand here: well below the Tg the strand is locked stiff and the beads cannot shift; as the temperature climbs past the Tg, the strand becomes supple and whole segments begin to wiggle and slide past one another. Both mechanical and electrical properties degrade noticeably once the temperature rises above the Tg.
The Tg is usually a narrow temperature range rather than a single sharp point, unlike a freezing or boiling temperature. The most common way to estimate the Tg is through the coefficient of volumetric expansion, since a change in the slope of the volume–temperature curve appears at the Tg.
Other common methods are differential thermal analysis (DTA) and differential scanning calorimetry (DSC), both specified in ASTM D3418.
Vicat Softening Point — ASTM D1525, ISO 306
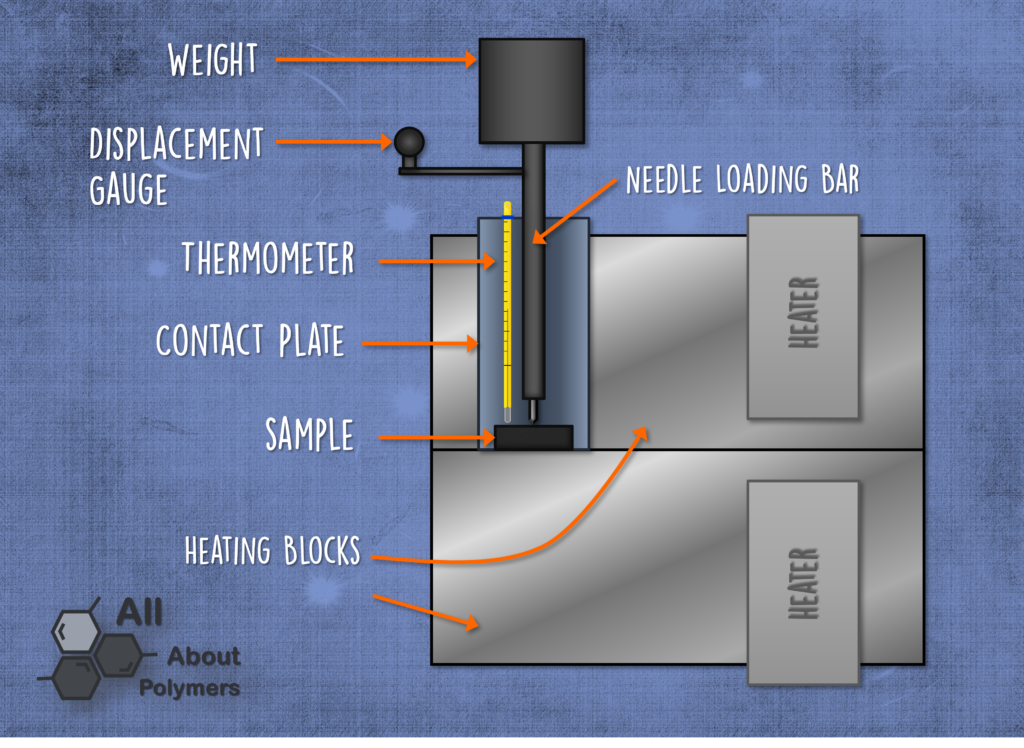
This is the temperature at which a flat-tipped needle of 1 mm² cross-section penetrates 1 mm into a material under a specified load and heating rate. The Vicat softening temperature is useful for comparing the heat-softening behavior of different materials. Two heating rates and two loads may be used for the test.
Heat Deflection Temperature Under Load — ASTM D648, ISO 75
The heat deflection temperature under load (HDT, also called Deflection Temperature Under Load, DTUL) is the temperature at which a specimen deflects 0.25 mm when loaded in three-point bending to a specified maximum stress. It is used to gauge short-term heat resistance. The specimen is loaded edgewise in three-point bending; the loads used are 0.455 MPa (66 psi) and 1.82 MPa (264 psi). Temperature is raised at 2 °C/min until the specimen deflects 0.25 mm (0.010 in).
Service Temperatures — DIN 53476
The service temperature is a material characteristic that indicates its thermal stability in use. Both an upper and a lower temperature should be considered, along with the length of time the material will spend at that temperature, in order to set sensible limits for each application.
Other Important Thermal Properties
- Coefficient of linear thermal expansion (DIN 53752)
- Glass transition temperature (ASTM E1356)
- Thermal conductivity (ASTM C177, ISO 8302)
“Thermal properties tell us how a polymer behaves as it heats and cools — when it softens, when it flows, and when it loses its useful stiffness.”
Electrical Properties
Polymers are predominantly electrical non-conductors, or insulators. Properties such as resistivity and dielectric strength are decisive for their use as insulating materials. That said, the conductivity of plastics can be tuned deliberately through additives or fillers — the changes can go so far as to produce highly conductive materials.
Dielectric Strength — ASTM D149, IEC 60243-1
Dielectric strength is the voltage per unit thickness at which a material begins to conduct electricity. The higher this value, the more electrically insulating the material is.
The specimen is placed between two electrodes, and voltage is applied in a specified way until the material suffers dielectric breakdown — an electrical burn-through that punctures the specimen. The test uses one of three methods:
• Slow rate of rise: voltage is raised at a uniform rate until breakdown.
• Short time: voltage starts at 50% of the breakdown voltage and rises at a uniform rate until breakdown.
• Step by step: voltage starts at 50% of the breakdown voltage and rises in equal steps, each held for a specified time, until breakdown.
Volume Resistivity and Surface Resistivity — ASTM D257, IEC 60093
Volume Resistivity and Surface Resistivity — ASTM D257, IEC 60093
Volume resistivity is the resistance to leakage current through the body of an insulating material — the ratio of the potential gradient parallel to the current to the current density. In SI units, it is numerically equal to the direct-current resistance between opposite faces of a one-meter cube of material (Ohm·m).
Surface resistivity is the resistance to leakage current along the surface of an insulating material: the electrical resistance between two parallel electrodes in contact with the surface and separated by a distance equal to their length of contact. Because the four ends of the electrodes define a square, the lengths in the ratio cancel out, and surface resistivity is reported in ohms — though you will often see the more descriptive unit ohms per square.
Optical Properties
Gloss — ASTM D2457, ASTM D523
Gloss is a measure of how bright or reflective a material is at a specified angle, based on its refractive index.
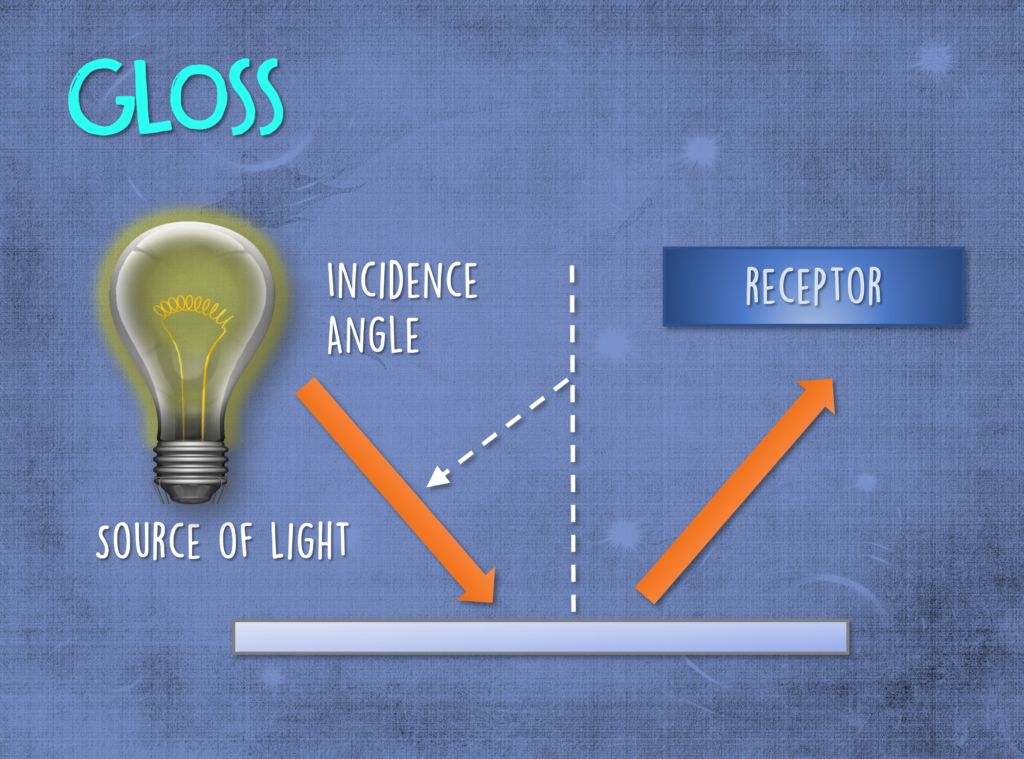
An incandescent light source is aimed at the specimen at a specified angle of incidence, and a receiver is placed at the specular (mirror) reflection of that beam. A polished black glass with a refractive index of 1.567 is the standard, assigned a gloss of 100 for all geometries. Measurements are taken with a gloss meter.
The geometries used for gloss measurement are:
• 20° — high gloss
• 60° — intermediate gloss
• 85° — low (sheen) gloss; a 45° angle is also used, mainly for films
Gloss values can only be compared between similar materials tested by similar procedures. Values for transparent and opaque materials are not comparable. Gloss varies with surface roughness and flatness, so it is sometimes used to evaluate those qualities as well.
Haze and Transmittance — ASTM D1003
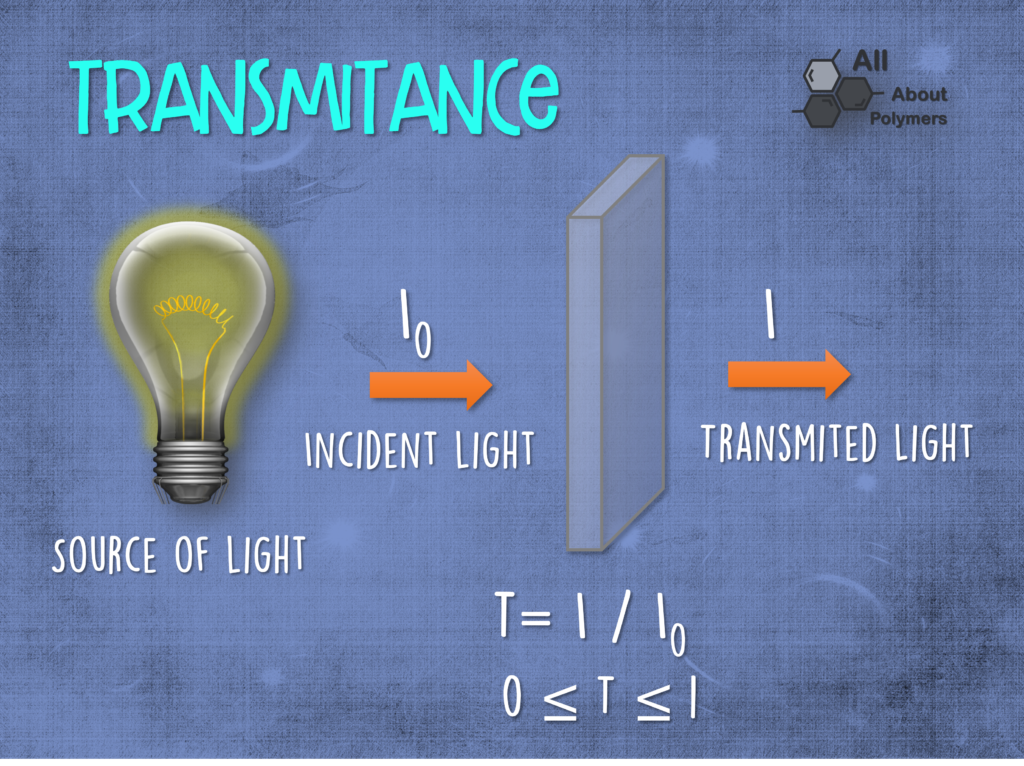
Transmittance is the percentage of incident light able to pass through a material; the higher the transmittance, the more transparent the material.
Haze is the percentage of transmitted light scattered more than 2.5° from the direction of the incident beam. Materials with haze values above 30% are considered diffusers.
In semicrystalline polymers, much of this haze comes from light scattering at the boundaries between crystalline and amorphous regions, where the refractive index changes from one to the other. This is why highly crystalline polymers tend to look translucent or milky, while amorphous polymers can be glass-clear.
The test is run either in a hazemeter (Procedure A) or a spectrophotometer (Procedure B). In both cases, light passes through the sample on its way to a photodetector. When the hazemeter and spectrophotometer values disagree, the hazemeter values take priority.
Yellowness Index — ASTM E313
The yellowness index is a number calculated from spectrophotometric values that describes the shift in color of a clear or white specimen toward yellow. It is most often used to evaluate color changes caused by exposure to UV light, thermal degradation, and similar effects.
Other Properties
Density and Specific Gravity — ASTM D792, ASTM D1505, ASTM D4883, ISO 1183
The density (or volumetric mass density) of a substance is its mass per unit volume. The symbol most commonly used is ρ (the lowercase Greek letter rho), though the letter D is also seen. Mathematically, density is the mass of a substance divided by its volume:
ρ = m / V
where ρ is density, m is mass, and V is volume.
Specific gravity is the ratio of the density of a substance to the density of a reference substance. It is abbreviated Sg.
The reference substance is usually water, whose density is very close to 1 g/cm³. Specific gravity is calculated as:
SgSUS = ρSUS / ρH2O
Because it is a ratio, specific gravity is a dimensionless value. For plastics, both densities are typically taken at the same reference temperature (often 23 °C).
Melt Flow Index — ASTM D1238
The melt flow index — known by its initials MFI (melt flow index) or MFR (melt flow rate) — measures how easily a molten thermoplastic flows. It is defined as the mass of polymer, in grams, that flows in ten minutes through a capillary die of specified diameter and length at a given pressure and temperature. It is reported in grams per 10 minutes (g/10 min).
The melt flow index can be used to tell grades apart, or to gauge how far a material has degraded. When a polymer degrades, its molecular chains break apart; here the bead-strand picture is useful — a long strand snipped into shorter pieces slips through the die far more easily than the original, so a degraded material flows faster and shows a higher MFI.
Dynamics and Rheology
Polymers are long molecules built by joining many small molecules (monomers). Sometimes those molecules are linear, but very often they are branched — low-density polyethylene (LDPE), used for films, bags, and squeezable bottles, is a classic example of a heavily branched polymer.
During the manufacture of plastic materials and products, polymer-containing liquids are made to flow. How they respond is governed by the shapes the molecules take. Polymer molecules behave like springs and are stretched out by flow, which gives polymer fluids their strongly elastic character. Studying these dynamics is central to understanding how polymer fluids flow.
If polymer molecules overlap enough, they become entangled — like spaghetti, or like several long bead strands tangled together — so that their movement is restricted. The “tube model” for entangled polymers gives a conceptual framework for understanding this restricted motion and for making mathematical predictions about how polymers respond to flow. Branch points act as extra obstacles, so the distribution of branches along the molecules can be a critical factor in the final flow properties.
All plastics are non-Newtonian: their viscosity does not stay constant across a range of shear rates. Strictly speaking, a plastic’s rheological behavior is a blend of non-Newtonian and Newtonian behavior. At lower shear rates the plastic is non-Newtonian, but as the shear rate rises it tends toward Newtonian behavior. This happens because, as shear rate increases, the polymer molecules begin to disentangle and line up in the direction of flow — the tangled strands straighten out and slip past one another more freely.
Moisture Absorption — ASTM D570, ISO 62
This is the percentage increase in a material’s weight after exposure to specified moisture conditions. Moisture absorption can affect both the mechanical and the electrical properties of a polymer. The amount of moisture taken up depends on several factors: the type of polymer, its additives, and the temperature, time, and conditions of exposure.
Three types of moisture absorption are commonly measured:
• After 24 hours: parts are immersed in water at 23 °C for 24 hours.
• Saturation moisture: parts are immersed in water at a set temperature until they reach a maximum weight.
• Equilibrium moisture: parts are exposed to ambient humidity, typically for 24 hours at 23 °C and 50% relative humidity.